Objectives
- Using PSpice to solve steady-state phasor problems
- Observing the frequency response characteristics of different types of analog filters
Part A: Steady-State AC Analysis in PSpice
In addition to DC circuit analysis and transient analysis, PSpice can be used to work steady-state phasor problems.
AC Voltage and Current Sources
The syntax for an AC source is very similar to its DC counterpart. The AC source is assumed to be a cosine waveform at a specified phase angle. Its frequency must be defined in a separate " .AC " command that defines the frequency for all the sources in the circuit. The unique information for the individual source is: the name, which must start with "V" or "I," the node numbers, the magnitude of the source, and its phase angle. Some examples follow.
*name nodelist type value phase(deg)
Vac 4 1 AC 120V 30
Vba 2 5 AC 240 ; phase angle 0 degrees
Ix 3 6 AC 10.0A -45 ; phase angle -45 degrees
Isv 12 9 AC 25mA ; 25 milliamps @ 0 degrees
Vac 4 1 AC 120V 30
Vba 2 5 AC 240 ; phase angle 0 degrees
Ix 3 6 AC 10.0A -45 ; phase angle -45 degrees
Isv 12 9 AC 25mA ; 25 milliamps @ 0 degrees
Here source type, AC, must be specified, because the default is DC. If the phase angle is not specified it will be assumed as zero degrees. The units of the phase angle will be in degrees. For voltage source the node on the left is the positive node and the node on the right is the negative node. Similarly, incase of current source positive current flows into the source from the node on the left, passes through the source, and leaves the source from the node on the right.
In some of your previous experiments you have used "SIN" type of source which is one of several useful source types (also EXP, PULSE, PWL, etc) that are used for transient analysis. Do not attempt to use SIN for steady-state (phasor) AC analysis nor for frequency sweeps. The SIN type is a time-based function for time-based analysis, whereas the AC type is used in frequency-based modeling. Since phasor analysis uses frequency-based models of circuit elements, always use the AC type as described in this experiment.
Use of the .PRINT AC Command
To enable .PRINT command .AC command must be used. The .AC command was designed to make a sweep of many frequencies for a given circuit. This is called a frequency response and will be discussed in Part B of this experiment. Three types of ranges are possible for the frequency sweep: LIN, DEC and OCT. At this time we only want a single frequency to be used so it does not matter which one we choose. We will pick the LIN (linear) range to designate our single frequency.
* type #points start stop
.AC LIN 1 60Hz 60Hz; <== single frequency
.AC LIN 6 100 200; <== a linear range sweep
.AC DEC 20 1Hz 10kHz; <== a logarithmic range sweep
.AC LIN 1 60Hz 60Hz; <== single frequency
.AC LIN 6 100 200; <== a linear range sweep
.AC DEC 20 1Hz 10kHz; <== a logarithmic range sweep
The first statement above performs a single analysis using the frequency of 60 Hz. Placing the units "Hz" after the value is optional. The second statement would perform a frequency sweep using frequencies of 100Hz, 120Hz, 140Hz, 160Hz, 180Hz, and 200Hz. The third statement performs a logarithmic range sweep using 20 points per decade over a range of four decades. This will be useful later for studying frequency response of circuits.
Finally, we can discuss the actual .PRINT AC command. Printing the components of phasor values (complex numbers) requires some options. There are four expressions needed for this: magnitude, phase (angle), real part and imaginary part. In addition, we can print voltages or currents. For instance, to print the magnitude of a voltage between nodes 2 and 3, we would specify "VM(2,3)." The phase angle of this same voltage would be "VP(2,3)" and would be printed in degrees. If we need the current magnitude through resistor Rload, we would specify "IM(Rload)." The real part of the voltage on node 7 would be specified "VR(7)" and its imaginary part, "VI(7)." As with the .PRINT DC command, there is no limit on the number of times it can be used in a listing; nor is there a limit on how many print requests can be on a single line.
.PRINT AC VM(30,9) VP(30,9); magnitude & angle of voltage
.PRINT AC IR(Rx) II(Rx); real & imag. parts of current through Rx
.PRINT AC VM(17) VP(17) VR(17) VI(17); the whole works on node 17
.PRINT AC IR(Rx) II(Rx); real & imag. parts of current through Rx
.PRINT AC VM(17) VP(17) VR(17) VI(17); the whole works on node 17
Example Circuit
We will analyze the following circuit at a frequency of 60 Hz.
60 Hz AC Circuit
Vs 1 0 AC 120V 0
Rg 1 2 0.5
Lg 2 3 3.183mH
Rm 3 4 16.0
Lm 4 0 31.83mH
Cx 3 0 132.8uF
.AC LIN 1 60 60
.PRINT AC VM(3) VP(3) .PRINT AC IM(Rm) IP(Rm) .PRINT AC IM(Cx) IP(Cx)
.END
In the above listing, the .AC command sets up the analysis for a single solution at 60 Hz. The .PRINT AC command tells PSpice to report on the voltage magnitude and phase angle at node 3, and the current magnitude and phase angle for the current through resistor Rm and the current magnitude and phase angle through capacitor Cx.
Practice Problem
Draw the circuit shown in figure 1 in schematic and analyze it for the source frequency of 50 Hz. Check whether KCL is satisfied in node 3. Also check KVL for both loops.
Part B: Frequency Sweep
In this section we will discuss frequency sweeps over a range of frequencies. The purpose of this type of analysis is to study the frequency response of different kinds of circuits.Specifying frequency range for AC Sources
.AC command is used to specify one of the following three types of frequency ranges.LIN Range Type
The LIN range type is linear. It divides up the range between the minimum and maximum user-specified frequencies into evenly spaced intervals. This is best used to view details over a narrow bandwidth. The first parameter after the keyword LIN is the number of points to calculate. This is followed by the lowest frequency value in Hz, then the highest frequency value in Hz. As with all the range types, the unit "Hz" is optional.
.AC LIN 101 2k 4k ; 101 points from 2 kHz to 4 kHz
.AC LIN 11 800 1000 ; 11 points from 800 Hz to 1 kHz
.AC LIN 11 800 1000 ; 11 points from 800 Hz to 1 kHz
OCT Range Type
The OCT range is logarithmic to the base two. Thus each octave has the same number of points calculated. This is somewhat useful for designing electronic equipment for musical applications. However, the resulting graphs are very similar in appearance to sweeps made with the DEC range. The first parameter after the keyword OCT is the number of points per octave to calculate. This is followed by the lowest frequency value in Hz, then the highest frequency value in Hz.
.AC OCT 20 440Hz 1.76kHz; 20 points/octave over 2 octaves
.AC OCT 40 110Hz 880Hz ; 40 points/octave over 3 octaves
.AC OCT 40 110Hz 880Hz ; 40 points/octave over 3 octaves
DEC Range Type
The DEC range is logarithmic to the base ten. Thus each decade has the same number of points calculated. This is the most commonly used range for making Bode plots of a frequency response. The first parameter after the keyword DEC is the number of points per decade to calculate. This is followed by the lowest frequency value in Hz, then the highest frequency value in Hz.
.AC DEC 50 1kHz 100kHz ; 50 points/decade over 2 decades
.AC DEC 25 100k 100MEG ; 25 points/decade over 3 decades
.AC DEC 25 100k 100MEG ; 25 points/decade over 3 decades
Probe
The independent variable used by PROBE in a .TRAN analysis is time. But in a frequency sweep the independent variable used by PROBE is frequency. When PROBE stores data in a transient (.TRAN) analysis, the dependent variables are instantaneous voltages and currents; whereas in a frequency sweep these dependent variables are real and imaginary components of phasor voltages and currents.
Examples of Frequency Sweeps

First-order low-pass RC filter
Vin 1 0 AC 1.0V
R1 1 2 0.25
C1 2 0 50uF
.AC DEC 20 100Hz 100kHz
.PROBE
.END
Vin 1 0 AC 1.0V
R1 1 2 0.25
C1 2 0 50uF
.AC DEC 20 100Hz 100kHz
.PROBE
.END
The above circuit is a first-order low-pass filter. Since we want the gain of this filter, it is convenient to make the input voltage 1 volt so the output voltage is numerically equivalent to the gain. However, the post-processor within PROBE is fully capable of performing arithmetic such as dividing the input voltage into the output voltage.
After running this in PSpice, start PROBE, choose "Add" from the "Trace" menu and plot the output voltage. PROBE will provide the following graph.

Another option is to have PROBE plot the gain in decibels. To do this, choose "Add" from the "Trace" menu in PROBE. Then select the "DB" function in the right-hand column and choose "V(2)" from the left-hand column. After selecting "OK," you should see the following trace.

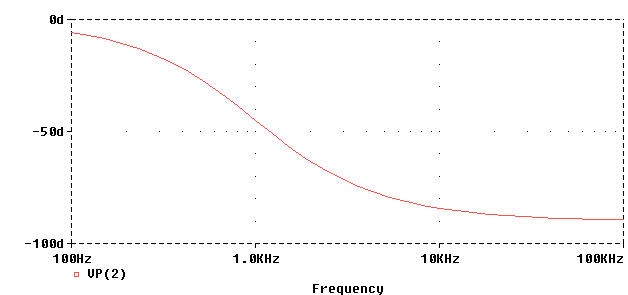
Notice that the gain is -3db at a frequency of 1 kHz (the half-power frequency) and declines at 20 dB/decade thereafter. The remaining demonstration for this example is to have PROBE plot the phase shift of the low-pass filter as a function of frequency. We simply specify "VP(2)" from the "Add Trace" dialog box. Notice that this is the same format used in the .PRINT AC command in PSPICE. PROBE automatically shows the angles in degrees.
This Is Very Important for Us
ReplyDelete
ReplyDeleteDa đầu Vương Lâm tê dại. Cấm Phiên vô dụng, Tiên Kiếm cũng vô dụng, Xạ Thần Xa cần phải có thời gian chuẩn bị để đối mặt với lão già cũng là vô dụng.
Ánh mắt Vương Lâm chớp động hàn quang. Tay phải hắn lại vuốt lên túi trữ vật, một cái Cấm Phiên khác lại xuất hiện trong tay. Tay trái hắn đánh ra cấm chế bay thẳng về phía lão già.
Lão già nhìn chằm chằm vào Cấm Phiên, lắc đầu nói:
- Bảo vật trên người tiểu bối ngươi quả thật rất nhiều, chắc chắn ở trên mặt đất cũng là đệ tử của một môn phái lớn. Trên vật này đều có một cỗ lực lượng thiên uy. Trận pháp này sau khi hoàn chỉnh thì tu sĩ của các ngươi sẽ nói có Thiên Kiếp giáng xuống. Nếu như ở trên mặt đất thì có thể uy hiếp được lão phu. Nhưng đây là thánh địa của Tiên Di tộc, là một thế giới khác, Thiên Kiếp không thể phủ xuống được. Ngươi cứ thử xem.
Lão già nói xong, tay phải lại đưa về phía trước.dong tam mu lậu cho thuê nhà trọ cho thuê nhà trọ nhạc sàn cực mạnh tư vấn pháp luật qua điện thoại công ty luật số điện thoại tư vấn pháp luật dịch vụ thành lập công ty
Lúc này tốc độ của lão cũng không nhanh nhưng uy lực lại mạnh mẽ hơn vừa